Caret is a free program for surface-based analysis and visualization of brain data, developed by David van Essen and colleagues. It allows for the segmentation, surface reconstruction, flattening, and visualization of cortical surface, including functional activations. In my research, I found it useful, not only to visualize my data on a surface-based representation, but also to do statistics of functional activations on those surfaces. With this motivation, I developed a Matlab-toolbox, which allows reading, writing and manipulating caret-files. These functions provide functionality for performing t-tests and simple linear models (ANOVA's) on a surface. A table of local maxima, with corrected voxel- and cluster-wise p-values (using Gaussian Field theory, following exactly the model established in SPM2) can then be easily generated.
 |
STATISTICS: one-sample t-test: mean<0 ======================================================= c NumN Area max(Z) p(unc) p(cor) p(cl.) X(mm) Y(mm) Z(mm) ------------------------------------------------------------------------------- 4 94 167.08 6.113 0.000 0.685 0.000 -55.16 -22.43 51.12 3 74 128.65 6.505 0.000 0.517 0.000 -44.74 -31.35 44.44 1 34 50.36 4.586 0.000 1.000 0.010 -31.88 -53.18 63.40 5 13 28.02 5.911 0.000 0.771 0.284 -43.57 17.30 43.01 2 16 17.44 7.078 0.000 0.315 0.834 -29.51 -45.02 66.19 ------------------------------------------------------------------------------- Height threshold: T = 3.61, p = 0.002 (1.000) Extent threshold: k = 17.00 sqmm, p = 0.067 (0.854) Expected sqmm per cluster, <k> = 6.298 Expected number of clusters, <c> = 1.92 Expected surface above threshold (sqmm) = 180.02 Degrees of freedom = [1.0, 12.0] Smoothness FWHM = 6.2 (mm) Search vol: 100582 sqmm; 2619.7 resels =======================================================
|
|
|
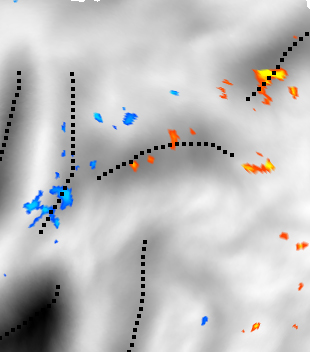
Left: A t-statistics calculated on the cortical surface of the
PALS-Atlas (van Essen, in press).
|
||
A detailed description of the approach taken here and the functions can be found in the following pdf-document:
![]() Diedrichsen, J. (2005). Surface Statistics using Caret. Resource available
online at http://www.bme.jhu.edu/~jdiedric/download/Caret_surface_statistics.pdf.
Diedrichsen, J. (2005). Surface Statistics using Caret. Resource available
online at http://www.bme.jhu.edu/~jdiedric/download/Caret_surface_statistics.pdf.
Download the toolbox
![]()
, unzip the archive, and place the folder "caret" in your matlab-path.
Example data for the
tutorial is available here.
![]()
The toolbox provides the following functions:
| 1. File-IO | ||
| caret_load | loads a metric,coord,topo,paint,surface_shape into a structure | |
| caret_save | saves a caret-structure into a file | |
| caret_savemetric | saves a Metric-structure as file | |
| caret_savepaint | saves a Paint-structure as file | |
| caret_struct | generates a new structure to hold a file | |
| 2. Surface operations | ||
| caret_getsurface | loads a .coord and .topo file into a surface structure | |
| caret_calcarea | calculates the Euler Characteristic, circumference and area of the search region | |
| caret_calcneighbor | makes a list of neighborhood relationships (needed for caret_cluster) | |
| caret_surfacesubset | makes a subset of surface for small-volume correction | |
| 3. Metric file operations | ||
| caret_regionstat | Extract the value from metric files based on ROIs specified in a paint file | |
| caret_mask | Masks out areas from a metric file, by applying logical mask, specified in a different metric file | |
| caret_threhold | thresholds a metric file on a height and clustersize threshold | |
| 4. Statistical Maps | ||
| caret_getcSPM | makes a statistical map from metric data (using a GLM) | |
| caret_savecSPM | saves a statistical map as a metric file | |
| caret_estsmoothness | estimates the smoothness of a statistical map | |
| caret_clusters | finds clusters on statistical map | |
| caret_P | calculates corrected, and cluster-wise p-values | |
| caret_list | lists maxima, clusters, p-values | |